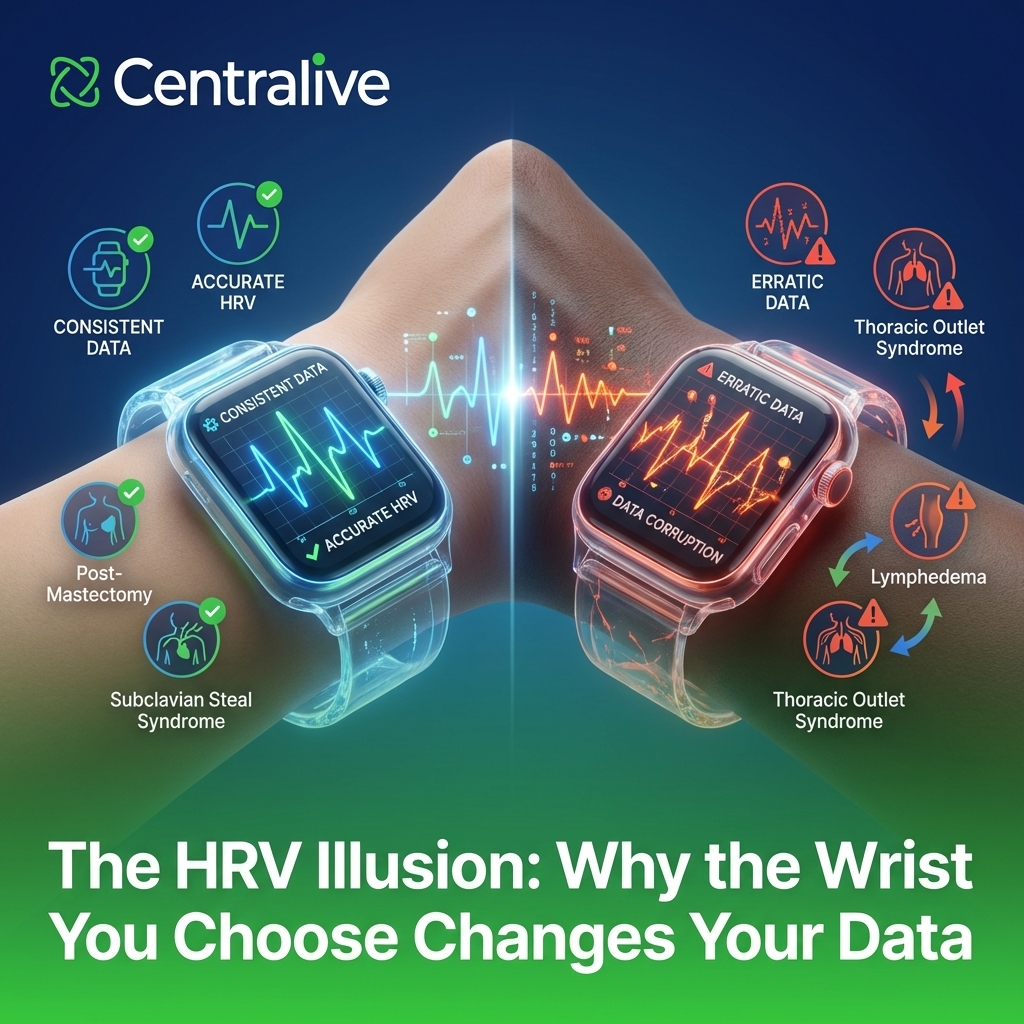
The HRV Illusion: Why the Wrist You Choose Changes Your Data
Imagine spending six months collecting longitudinal Heart Rate Variability (HRV) data from a cohort of patients using the latest smartwatches. You run the numbers, and the results are incredibly erratic. Your conclusion? The intervention failed. The reality? Your participants kept switching their watches from their left to their right wrists.
For researchers utilizing wearable Photoplethysmography (PPG) technology, the assumption of bilateral symmetry is a dangerous trap. While the heart is the singular source of your rhythm, PPG sensors do not measure electrical activity like an ECG. Instead, they measure peripheral blood volume displacement.
Macro-Vascular and Clinical Interferences
Your vascular tree acts like a physical filter for your pulse wave. If that filter is asymmetrical, your data will be too.
- Subclavian Steal Syndrome: A narrowing of the artery can cause a delayed pulse arrival time and a dampened amplitude, effectively smearing the systolic peak.
- Post-Mastectomy Lymphedema: Accumulation of interstitial fluid increases the path length of the light from the PPG sensor, scattering the signal and reducing the Signal-to-Noise Ratio.
- Thoracic Outlet Syndrome: Compression of the neurovascular bundle might only happen when a participant sleeps on a specific side, leading to dropped beats on only one limb.
The Jitter Effect and Data Corruption
Why do these physical differences matter to data scientists? In HRV research, we look for milliseconds of difference. If a condition causes the PPG systolic peak to become rounded rather than sharp, peak-detection algorithms lose their precision.
If the signal is dampened, the algorithm might detect the peak at 802ms, then 795ms, then 808ms. The heart rhythm didn’t change; the point of maximum inflection simply became harder to find. This artificially inflates HRV metrics, leading to false conclusions about parasympathetic activity.
Recommendations for Clinical Researchers
- Mandate Consistency: Participants must use the same hand throughout the entire study to prevent data step-changes.
- Screen for Asymmetries: Ask about AV fistulas, previous mastectomies, dark tattoos (which block sensor light), and Raynaud’s phenomenon.
- Use Signal Quality Indices (SQI): Don’t blindly trust the HRV output. Check the percentage of interpolated beats. If the dominant hand has a 20% interpolation rate due to motion artifacts, the data is clinically useless.
Ready to level up your clinical data science? Subscribe to the Centralive Newsletter for weekly insights on wearable tech, HRV analysis, and health data accuracy.