HRV Features and Associated Outcomes
At Centralive, we believe your body is constantly talking to you—you just need to learn the language. While most people obsess over step counts or resting heart rate, the true story of your mental and physical resilience is written in the gaps between your heartbeats.
This is Heart Rate Variability (HRV). Unlike a metronome, a healthy heart is chaotic and responsive. Health data science allows us to peer into this chaos to identify patterns associated with stress, fatigue, and mental health conditions often before you consciously feel them.
1. Time-Domain: The Foundation of Resilience
These metrics measure the variation in time intervals between beats. Think of this as the bedrock of your biometric profile.
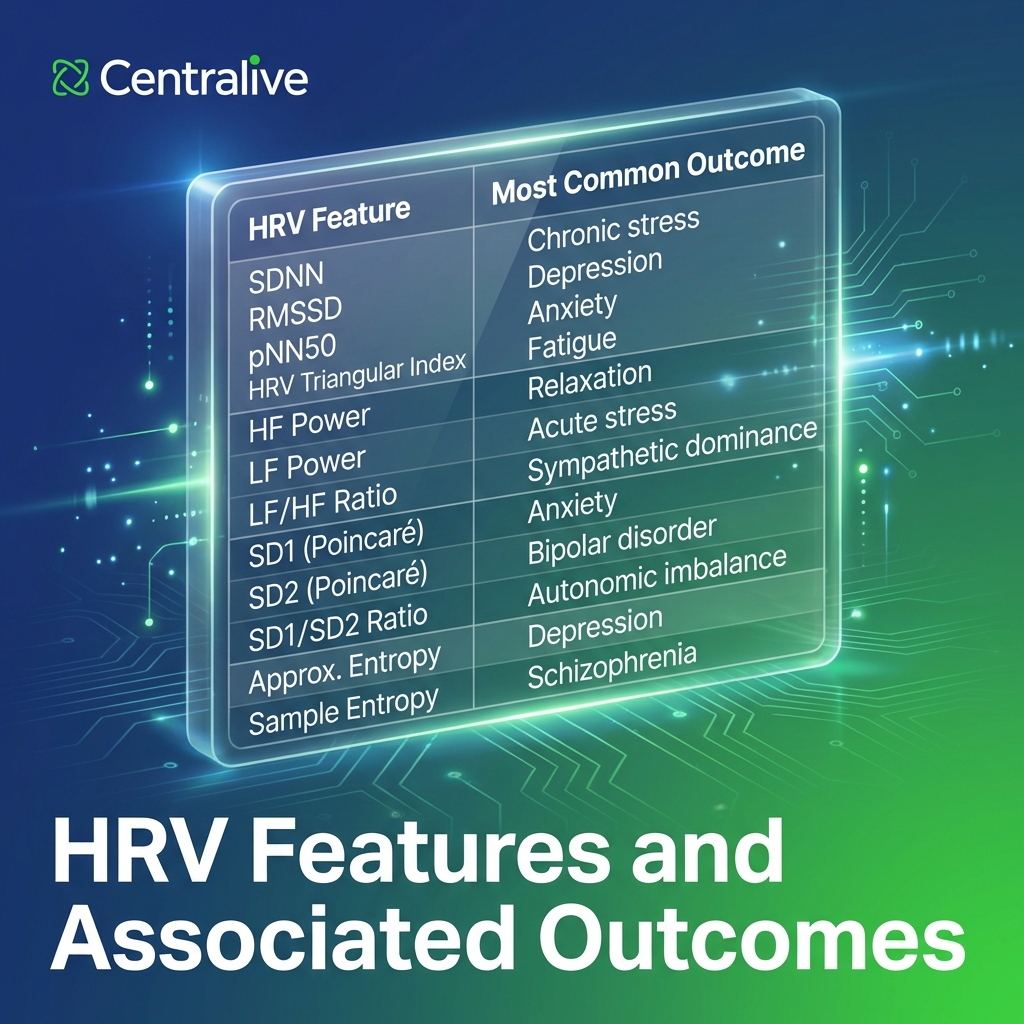
- SDNN (The Gold Standard): Reflects your overall circadian rhythm. Low values are strongly correlated with Chronic Stress and a compromised immune system.
- RMSSD (The Recovery Tracker): The primary metric for tracking vagal tone (parasympathetic activity). If this is consistently suppressed, it is a frequent biomarker for Depression.
- pNN50 (The Reflex): Measures sudden rhythm changes. A drop here indicates a rigid nervous system, often observed in Anxiety disorders.
2. Frequency-Domain: The Rhythm of Fight or Flight
By analyzing the frequency of your heart rate, we can see a tug-of-war between your nervous system’s two branches: the Sympathetic (Gas pedal) and Parasympathetic (Brake).
- HF Power (Relaxation): High power here signals strong recovery capacity and a state of rest.
- LF Power (The Mix): Elevations here are often linked to Acute Stress responses and blood pressure regulation.
- LF/HF Ratio (The Balance): A high ratio indicates Sympathetic Dominance—essentially, your body is stuck in “fight or flight” mode.
3. Non-Linear Analysis: The Vital Chaos
This is where data gets fascinating. In health data science, loss of complexity often signals illness. A heart that beats with perfect predictability is a heart that cannot adapt.
- Poincaré Plot (SD1 & SD2): Visualizes variability. Irregularities in long-term variability (SD2) have been linked to Bipolar Disorder, while short-term issues (SD1) associate with Anxiety.
- Entropy (Unpredictability): We want high entropy. Significant reductions in “Sample Entropy” (complexity) have been noted in conditions as severe as Schizophrenia.
- DFA (Fractal Patterns): Altered fractal patterns in the heartbeat (DFA-α1) are seen in cases of PTSD.
The Centralive Takeaway
Understanding these metrics moves us from simple fitness tracking to preventative mental health monitoring. These features are data points, not diagnoses, but they serve as a powerful early warning system for your well-being.
Get evidence-based guides delivered to your inbox.
Join the Centralive Newsletter