You have run your study, the devices are back, and the export contains dozens of columns. Which of them belong in your Methods and Results, how should they be defined, and what does a peer reviewer expect to see alongside them? This is one of the most common questions we hear from teams preparing to publish wearable data, and it rarely has a tidy answer, because there is no single reporting checklist for wearables. What exists instead is a layered set of conventions: a general reporting guideline chosen by study design, a domain specific guideline for your signal, and a fit for purpose framework for the device itself. This post assembles those layers into a practical reporting plan, with the specific variables, definitions, and statistics reviewers look for.
Why reporting wearable variables is harder than it looks
Three properties of consumer and research wearables make reporting non trivial. First, most devices expose a proprietary metric, not a raw signal, so two studies using nominally the same measure may be computing very different things. Second, firmware and algorithm updates change outputs silently over the life of a study, which is why the Sleep Research Society state of the science paper recommends the term “performance evaluation” over “validation,” noting that the continuous update of device features prevents establishing an absolute level of validity for any given device. Third, the same variable can support very different claims depending on how it was collected and validated. A metric adequate for a group level comparison may be useless for an individual clinical endpoint. The reporting conventions below exist precisely to make these differences legible to a reader.
Layer 1: device and data provenance
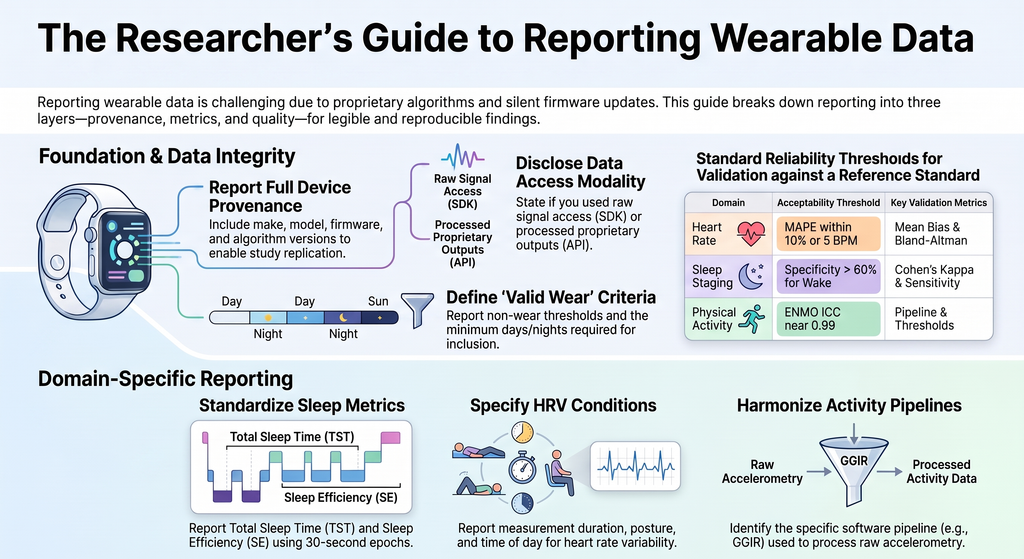
The single most frequently omitted, and most reproducibility critical, reporting element is the provenance of the data itself. Before any metric is interpretable, a reader needs to know exactly what produced it. Report the device make, model, and manufacturer; the firmware version; the algorithm or software version used to derive metrics; the sampling rate; the epoch length used for scoring; the wear location; and whether the same physical unit was used throughout longitudinal monitoring. Guidance for wrist worn consumer heart rate research goes further and recommends including a completed metadata checklist, covering device type, firmware version, and sampling rate, as supplementary material.
One provenance detail deserves its own line in your Methods because it determines whether your analysis can be reproduced at all: the data access modality. There is a structural difference between devices that expose raw signal through a hardware SDK and devices that return only processed outputs through an API. With raw signal access, per beat intervals, accelerometry, and per beat or per epoch confidence can be extracted, and key measures can be recomputed independently and transparently. With an API only architecture, such as the one Oura provides, the platform returns processed summaries that cannot be reconstructed and may change across firmware updates without notice. This is not a criticism of any device; it is a structural constraint on what a reader can verify. State plainly which modality you used, and if you relied on proprietary processed outputs, flag the reproducibility limitation directly.
Two conventions worth stating explicitly: raw accelerometry is typically sampled at 20 to 100 Hz per axis, whereas ECG based heart rate variability requires 250 to 500 Hz for accurate R wave detection per the foundational Task Force standard; and a 30 second epoch is the convention that aligns with polysomnography scoring, which most sleep staging algorithms are trained against.
Layer 2: the domain metrics and their definitions
Define every metric explicitly rather than assuming a shared understanding. The conventions below are organized by signal domain.
Sleep
Report total sleep time (TST), time in bed or sleep period (TIB), sleep onset latency (SOL), wake after sleep onset (WASO), and sleep efficiency, defined as SE = TST divided by TIB, multiplied by 100. Because TIB drives sleep efficiency and other derived metrics, and there is no field wide consensus on how actigraphy defines TIB, state your exact definition and whether a sleep diary corroborated it. For staging, report N1, N2, N3, and REM durations and percentages, but note that consumer devices typically collapse to a four class architecture of wake, light, deep, and REM, and stage level accuracy is limited. The World Sleep Society consensus explicitly advises against over interpreting sleep staging data and recommends emphasizing multiday averages and behavioral trends over nightly readings.Also report number of awakenings, sleep timing (onset, offset, midpoint), and, for regularity, the Sleep Regularity Index alongside complementary measures such as the standard deviation of sleep duration and of midpoint. Name the exact calculator or package you used for regularity indices, since implementations differ.
Heart rate and heart rate variability
Report resting heart rate, stating whether it is nocturnal or daytime, and average heart rate. For variability, follow the Task Force conventions: time domain measures RMSSD, SDNN, and pNN50, and frequency domain measures with the low frequency band defined as 0.04 to 0.15 Hz, the high frequency band as 0.15 to 0.4 Hz, and their ratio. Report lnRMSSD if you used it. Crucially, report the measurement conditions that determine comparability: the window and duration (24 hour, short term, or ultra short overnight), posture, and time of day. RMSSD is the most robust metric for short overnight windows and is the default output on most consumer wearables.
Physical activity and accelerometry
Report steps, sedentary time, and moderate to vigorous physical activity, stating the cut points and whether activity was bouted. From raw acceleration, report which metric you used, since results are not comparable across metrics: ENMO (Euclidean Norm Minus One) is the default in the widely used GGIR pipeline, with MAD as an alternative. Report the pipeline and its version, autocalibration, non wear detection, and thresholds. Between brand agreement within a common pipeline is high when processing is harmonized, with reported ENMO intraclass correlations near 0.99 across research grade brands, but this comparability depends entirely on reporting the exact processing choices.
Respiration, SpO2, and skin temperature
For each, report the reference used and agreement statistics. For SpO2 specifically, report performance against a reference oximeter and analyze across skin tones using a documented scale, since photoplethysmography accuracy can degrade with darker skin tones, motion, and obesity. For skin temperature, state whether values are absolute or relative trends and specify sensor placement.
Layer 3: data quality and completeness
Reviewers increasingly expect the completeness of your data to be reported as rigorously as the metrics themselves. Report your non wear detection rule and threshold; a common convention defines non wear as at least 60 consecutive minutes of zero counts. Report compliance and adherence as the proportion of participants and nights or days meeting valid wear criteria, and be explicit about reasons for data loss, whether technical failure, non adherence, or artifact. State how missing data were handled.
Most importantly, pre specify and justify your minimum valid days or nights criteria with reliability evidence for your specific metric, rather than applying a generic rule. For physical activity, a widely used convention is at least 10 hours of wear per day on at least 4 of 7 days. For actigraphy sleep, reliability work found that at least 2 nights are recommended for sleep percent, at least 5 nights for sleep efficiency, and more than 7 nights for total sleep time. Circadian phase estimation typically needs roughly two weeks of recording. Where signal quality metrics such as per beat or per epoch confidence are available, report artifact rejection rates, and note that photoplethysmography derived variability is reliable only under low movement conditions.
If you are validating against a reference standard
Validation reporting has a two part convention, and reviewers will expect both parts. The open source framework for testing sleep tracker performance operationalizes exactly this structure: discrepancy analysis, then Bland Altman analysis, then epoch by epoch analysis.
For continuous measures at the nightly or aggregate level, report the mean bias and the Bland Altman 95 percent limits of agreement, testing for proportional bias and heteroscedasticity, together with the intraclass correlation coefficient (specifying its form), Lin’s concordance correlation coefficient, and the mean absolute percentage error (MAPE). For heart rate, a common acceptability threshold is a MAPE within 10 percent or 5 beats per minute, whichever is greater, following the cardiac monitor convention.
For epoch by epoch classification of sleep and wake or of stages, report sensitivity, specificity, accuracy, and Cohen’s kappa, with a confusion matrix, and interpret kappa against the standard bands where 0.41 to 0.60 is moderate, 0.61 to 0.80 is substantial, and 0.81 to 1.00 is almost perfect. Report specificity prominently rather than leaning on accuracy, which is inflated by the fact that most epochs are sleep. A recurrent finding across devices is high sensitivity for detecting sleep but low specificity for detecting wake, with wake specificity frequently below 60 percent, which is why per stage metrics matter more than a single overall number.
Finally, state which of three use cases your evidence supports, and do not over claim beyond it: a clinical endpoint requires clinical validation and tight, characterized agreement with a gold standard; intra individual change tracking requires within person reliability and responsiveness; and a group level comparison requires only that any systematic bias is consistent across the groups being compared. A device with a large but constant bias may support a between group inference while being unusable for individual diagnosis.
Which frameworks to anchor to
Choose your general reporting guideline by design and pair it with a domain guideline. For trials, use CONSORT with the CONSORT-eHEALTH extension, which requires enough description of the technology to allow replication.For observational studies, use STROBE, with the RECORD extension when routinely collected data are involved. When a wearable feeds a prediction or machine learning model, use TRIPOD+AI, which emphasizes external validation, code sharing, and both discrimination and calibration. Layer on the fit for purpose framework for the device itself: the V3 framework, and its 2024 extension V3+, define verification, analytical validation, and clinical validation, with usability validation added in V3+, and you should report which components your device has evidence for. For the specific domain, draw on the sleep tracker performance framework and state of the science guidance, the actigraphy reporting checklist and society guidance, the accelerometry practical considerations and the INTERLIVE checklist for activity, and the Task Force standard plus the consumer heart rate guidelines for cardiac measures. Cite them in your Methods and include completed checklists as supplements.
A staged reporting plan
Rather than treating reporting as a final cleanup step, build it into three stages of your study.
- At design. Choose your general and domain guidelines up front and pre register the variables you will report, their definitions, and the minimum valid days or nights criteria with cited justification. Decide whether your claim is a clinical endpoint, individual change, or group comparison, because that determines the validation evidence you need.
- At collection. Lock the device model, firmware, and algorithm version, and record any updates that occur mid study, treating pre and post update data as potentially non equivalent. Prefer a data access modality that exposes raw signal so that key measures can be recomputed. Log wear time and non wear continuously so compliance is a measured quantity, not a retrospective estimate.
- At reporting. Publish a device provenance block, define every metric, report completeness and compliance transparently, and for any validation report both agreement and classification statistics. Share raw data and analysis code where consent and intellectual property allow.
Where raw signal access changes the reporting picture
Almost every convention above becomes easier to satisfy when you can reach the raw signal. Provenance reporting is stronger because you can state exactly what was computed and from what. Metric definitions are yours to fix and publish, rather than inheriting a black box. Data quality reporting is richer because per beat and per epoch confidence flags are available. Validation is transparent because measures can be recomputed independently. And reproducibility survives firmware updates because you retain the underlying data rather than a summary that may silently change.
This is the methodological reason Centralive is built on raw signal access through hardware SDKs. Through the Garmin Health Companion SDK, studies can capture raw beat to beat intervals, accelerometry, and per beat confidence flags, and through the Apple SDK studies can access device level signal rather than processed summaries alone. Raw access is what lets a research team write a provenance block that a reviewer can act on, define metrics that another group can reproduce, and report validation statistics computed on the actual signal. When the export contains dozens of columns, the columns worth reporting are the ones you can define, justify, and recompute, and raw signal access is what makes that possible.
References
- Goldsack JC, et al. Verification, analytical validation, and clinical validation (V3): the foundation of determining fit for purpose for Biometric Monitoring Technologies (BioMeTs). npj Digital Medicine. 2020;3:55. doi:10.1038/s41746-020-0260-4
- Goldsack JC, Dowling AV, Samuelson D, Patrick-Lake B, Clay I. V3+: extending the V3 framework to include usability validation. npj Digital Medicine. 2024. doi:10.1038/s41746-024-01322-2
- Eysenbach G; CONSORT-EHEALTH Group. CONSORT-EHEALTH: improving and standardizing evaluation reports of web based and mobile health interventions. Journal of Medical Internet Research. 2011;13(4):e126. doi:10.2196/jmir.1923
- von Elm E, et al. The Strengthening the Reporting of Observational Studies in Epidemiology (STROBE) Statement. PLoS Medicine. 2007;4(10):e296. doi:10.1371/journal.pmed.0040296
- Benchimol EI, et al. The REporting of studies Conducted using Observational Routinely collected health Data (RECORD) Statement. PLoS Medicine. 2015;12(10):e1001885. doi:10.1371/journal.pmed.1001885
- Collins GS, et al. TRIPOD+AI statement: updated guidance for reporting clinical prediction models that use regression or machine learning methods. BMJ. 2024;385:e078378. doi:10.1136/bmj-2023-078378
- Menghini L, Cellini N, Goldstone A, Baker FC, de Zambotti M. A standardized framework for testing the performance of sleep tracking technology: step by step guidelines and open source code. Sleep. 2021;44(2):zsaa170. doi:10.1093/sleep/zsaa170
- de Zambotti M, Goldstein C, Cook J, Menghini L, Altini M, Cheng P, Robillard R. State of the science and recommendations for using wearable technology in sleep and circadian research. Sleep. 2024;47(4):zsad325. doi:10.1093/sleep/zsad325
- de Zambotti M, et al. Rigorous performance evaluation (previously “validation”) for informed use of new technologies for sleep health measurement. Sleep Health. 2022;8(3):263-269. doi:10.1016/j.sleh.2022.02.006
- Chee MW, Baumert M, Scott H, Cellini N, Goldstein C, Baron K, Imtiaz SA, Penzel T, Kushida CA; World Sleep Society Sleep Tracker Task Force. World Sleep Society recommendations for the use of wearable consumer health trackers that monitor sleep. Sleep Medicine. 2025;131:106506. doi:10.1016/j.sleep.2025.106506
- Smith MT, et al. Use of actigraphy for the evaluation of sleep disorders and circadian rhythm sleep wake disorders: an American Academy of Sleep Medicine clinical practice guideline. Journal of Clinical Sleep Medicine. 2018;14(7):1231-1237. doi:10.5664/jcsm.7230
- Meltzer LJ, Montgomery-Downs HE, Insana SP, Walsh CM. Use of actigraphy for assessment in pediatric sleep research. Sleep Medicine Reviews. 2012;16(5):463-475. doi:10.1016/j.smrv.2011.10.002
- Ancoli-Israel S, Martin JL, Blackwell T, et al. The SBSM guide to actigraphy monitoring: clinical and research applications. Behavioral Sleep Medicine. 2015;13(sup1):S4-S38. doi:10.1080/15402002.2015.1046356
- Quante M, Kaplan ER, Rueschman M, Cailler M, Buxton OM, Redline S. Practical considerations in using accelerometers to assess physical activity, sedentary behavior, and sleep. Sleep Health. 2015;1(4):275-284. doi:10.1016/j.sleh.2015.09.002
- Aili K, et al. Reliability of actigraphy and subjective sleep measurements in adults: the design of sleep assessments. Journal of Clinical Sleep Medicine. 2017;13(1):39-47. doi:10.5664/jcsm.6384
- Argent R, et al. Recommendations for determining the validity of consumer wearables and smartphones for the estimation of energy expenditure: expert statement and checklist of the INTERLIVE network. Sports Medicine. 2022;52:1817-1832. doi:10.1007/s40279-022-01665-4
- Task Force of the European Society of Cardiology and the North American Society of Pacing and Electrophysiology. Heart rate variability: standards of measurement, physiological interpretation, and clinical use. Circulation. 1996;93(5):1043-1065. doi:10.1161/01.CIR.93.5.1043
- Nelson BW, Low CA, Jacobson N, Areán P, Torous J, Allen NB. Guidelines for wrist worn consumer wearable assessment of heart rate in biobehavioral research. npj Digital Medicine. 2020;3:90. doi:10.1038/s41746-020-0297-4
- Phillips AJK, et al. Irregular sleep/wake patterns are associated with poorer academic performance and delayed circadian and sleep/wake timing. Scientific Reports. 2017;7:3216. doi:10.1038/s41598-017-03171-4
Sign up for the Centralive Newsletter: https://newsletter.centralive.health/signup