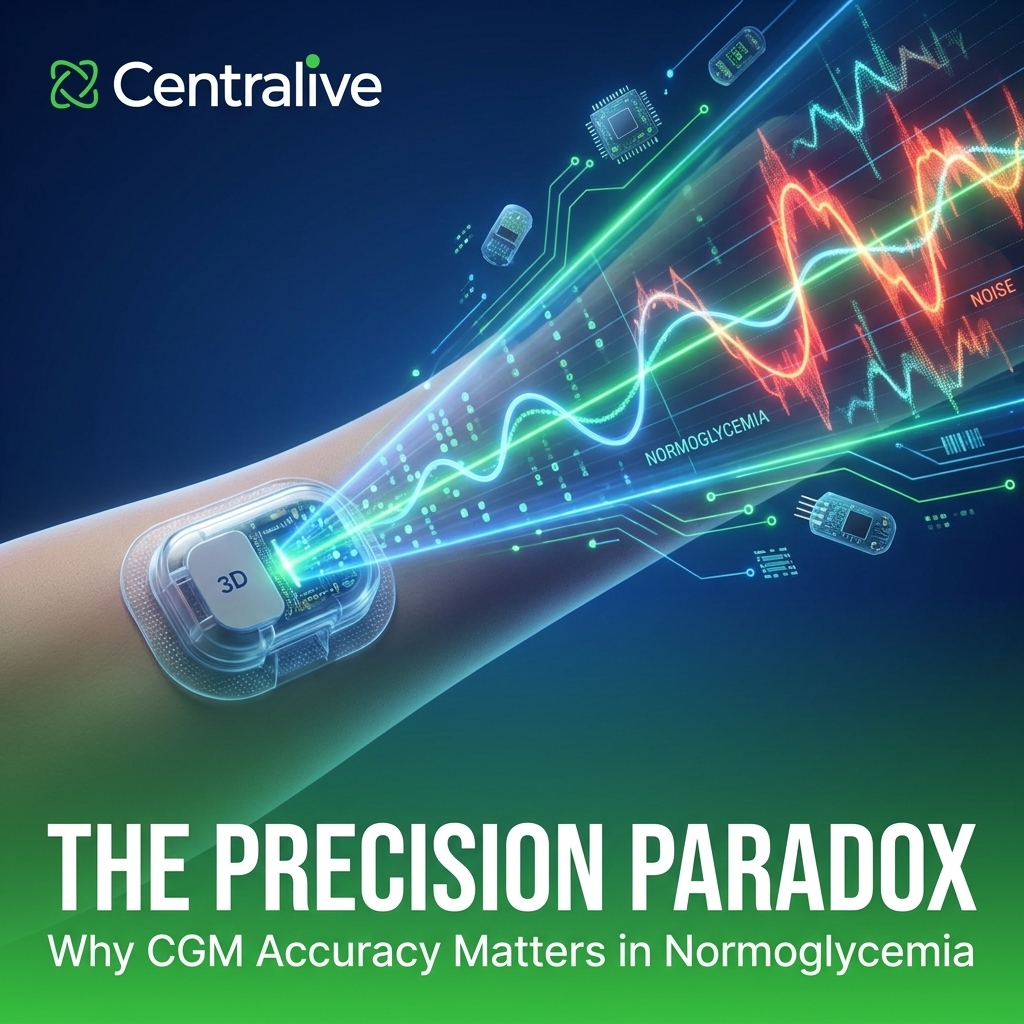
If you are designing a study that puts a continuous glucose monitor (CGM) on healthy participants, you are implicitly betting that the device can resolve the differences you care about. In people with diabetes, those differences are large: swings of 100 mg/dL or more, and clinical thresholds separated by tens of milligrams per deciliter. In people without diabetes, the real physiological signal is small. Glucose often sits between 70 and 140 mg/dL all day, postprandial excursions are modest, and the between-food differences that wellness apps dramatize are frequently 10 to 20 mg/dL. The question is whether a sensor whose error is on the order of 10 mg/dL can actually see a 10 mg/dL effect. This post works through the accuracy literature and ends with a practical design framework.
The short version
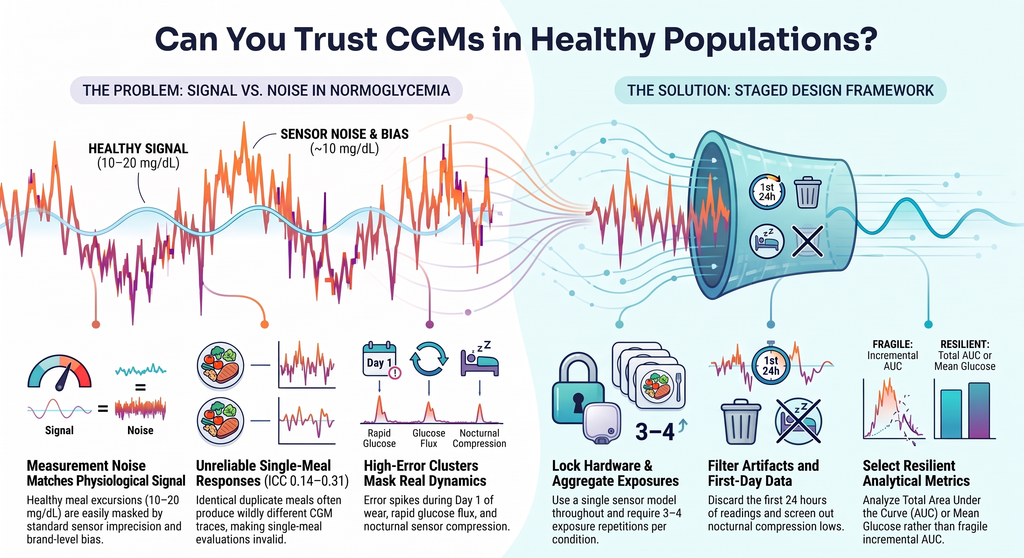
Modern CGMs are accurate enough to manage diabetes. They are not precise enough to reliably resolve the small, 10 to 30 mg/dL differences that matter in healthy people. In normoglycemia, per-reading sensor error, systematic bias between sensor brands, and meal-to-meal biological noise are all roughly the same size as the signal most consumer tools interpret. Trust CGM data for trends, large excursions, and aggregated cohort-level estimates. Treat single-meal verdicts, absolute values, cross-sensor comparisons, and near-threshold lows in healthy people with suspicion.
MARD is a headline, not a guarantee
The standard accuracy metric is Mean Absolute Relative Difference (MARD): the mean of the absolute percentage difference between each CGM reading and a time-matched reference, usually a YSI laboratory analyzer on plasma. A MARD below 10% is widely treated as sufficient for non-adjunctive diabetes use, a threshold that traces back to in-silico insulin-dosing modeling.1 Current sensors clear it in their manufacturer-run pivotal trials: Dexcom G7 reported 8.2% on the arm,2 FreeStyle Libre 3 reported 7.8%,3 FreeStyle Libre 2 with its advanced algorithm 9.2%,4 and Medtronic Guardian Sensor 3 roughly 8.7 to 9.6%.5
Three things keep that single number from meaning what it appears to mean.
It is an average that hides its own distribution. MARD blends bias and imprecision, so two sensors with identical MARD can behave very differently, one with good precision but large bias, the other the reverse.6 It is also sensitive to a handful of paired points and to the study protocol itself.7 In the G7 pivotal data the population MARD was 8.2%, but per-sensor MARD ranged widely, with about 1.9% of sensors exceeding 20%.2 Any one participant could be wearing an outlier.
The reference method changes the answer. In an independent head-to-head, the same Medtronic sensors produced a MARD of 11.6% against a YSI analyzer, 13.9% against a hexokinase analyzer, and 16.6% against a capillary meter. The ranking of devices changed with the comparator.8 The IFCC working group on CGM concluded that there is no single level of performance for a given system, but potentially as many levels as there are performance studies, and that systems can only be compared when tested in one study under a standardized protocol.9
Independent testing is less flattering. One Abbott-funded comparison reported Libre 3 at 8.9% and G7 at 13.6%, the latter far worse than G7’s own pivotal figure.10 A separate commentary noted that the comparator choice and visit scheduling in that study favored one device, and that the analysis was performed by the sponsor.11 The strongest independent comparison, from the Ulm institute, found all three major sensors between 11.6% and 12.0% against YSI, worse than their pivotal numbers.8
The regulatory floor sits above the normal range
The FDA integrated CGM (iCGM) special controls define a floor, not a precision specification.12 For readings between 70 and 180 mg/dL, where most healthy people spend their day, the standard only requires that the lower 95% confidence bound of readings within plus or minus 15% exceed 70%. Across the whole range, the bound for readings within plus or minus 20% must exceed 87%. In plain terms, a fully cleared sensor can be off by more than 15% on a meaningful share of readings in exactly the band healthy participants occupy. The over-the-counter wellness sensors, Dexcom Stelo13 and Abbott Lingo,14 were cleared against these same controls and inherit the same accuracy profile, which was validated in people with diabetes.
Error grids such as the Parkes/Consensus grid15 and the Surveillance Error Grid16 grade the clinical consequence of an error rather than its size, which is why near-universal results such as “99.9% in zones A and B” say little about the 10 to 30 mg/dL precision needed in normoglycemia. The zones were drawn around insulin-dosing risk, not around resolving small differences between foods.
Accuracy is worst where decisions are hardest
CGM error is not uniform. It concentrates at low glucose, on the first day of wear, and during rapid change.
- Low glucose. Because MARD is relative, a small absolute error becomes a large relative one as glucose falls, so studies switch to mean absolute difference (MAD) in mg/dL at the low end. In the G7 pivotal data, MAD was 8.5 mg/dL on the arm at readings of 40 to 60 mg/dL, while relative accuracy improved steadily as glucose rose.2 Detection of true lows is also imperfect and varies by device.8
- Day one. The first 12 to 24 hours are consistently the least accurate window. G7 day-1 MARD was 11.9% on the arm versus 8.2% overall.2
- Lag and rate of change. CGMs measure interstitial fluid, which trails plasma by a few minutes. The effective G7 lag was estimated at about 3.5 minutes,2 but it interacts with speed: G7 arm MARD rose from 7.8% when glucose was stable to roughly 9.3 to 9.7% when it was changing faster than 2 mg/dL per minute.2 During a postprandial rise, a CGM understates the true peak and shifts it later, which matters for any timing-based metric.
- Compression lows. Lying on a sensor reduces local perfusion and produces a real but local fall that the rest of the body does not share. With one sensor these artifacts lasted a median of 45 minutes and dropped readings by about 24 mg/dL, and false nocturnal lows appear in healthy people more often than expected.17 In healthy cohorts, treat nocturnal lows as artifact until proven otherwise.
In people without diabetes, the noise approaches the signal
Start with what normal looks like. In 153 healthy participants wearing a blinded sensor, median time between 70 and 140 mg/dL was about 96%, with mean glucose near 98 to 99 mg/dL.18 In the Framingham Heart Study, normoglycemic adults still spent roughly 3 hours a day, about 12% of the time, above 140 mg/dL.19 Excursions above 140 are normal physiology, not a finding.
Now the arithmetic. At 100 mg/dL, an 8 to 10% MARD is an average point error of about 8 to 10 mg/dL. The iCGM floor permits a meaningful fraction of readings to miss by more than 15 mg/dL. Brand-level bias can add another 10 to 15 mg/dL. The measurement error is therefore the same order of magnitude as the between-food difference under study. Three lines of direct evidence show what that does in practice.
- Two sensors on the same person disagree. In an inpatient study of adults without diabetes, two CGM brands worn simultaneously differed by about 12.9 mg/dL on average, and the two devices ranked the same meals differently. The authors concluded that personalized meal recommendations are CGM dependent.20
- The same meal twice gives different answers. Pooling two controlled feeding studies, responses to identical duplicate meals varied about as much as responses to different meals, with reliability (ICC) of only 0.14 to 0.31 depending on device.21 A later analysis argues that fragile endpoints such as incremental area under the curve exaggerate this, which is a fair point in favor of better endpoints, not in favor of single-meal interpretation.
- Low thresholds are especially fragile. In healthy cohorts, apparent time below 70 mg/dL can differ several-fold between sensor brands worn in parallel.22 The classic precedent is the DirecNet study of healthy children, where first-generation sensors showed median absolute differences of 13 to 17 mg/dL and false lows; those devices are obsolete, but the structural problem, narrow true variance against fixed sensor error, is not.23
Expert readers do not even agree on what a healthy CGM trace means: in one survey, 18 clinicians reviewing blinded reports from people without diabetes reached only slight agreement on whether to recommend follow-up (Fleiss kappa 0.36).24 A 2026 JAMA Internal Medicine review concluded that for people without diabetes there is no good evidence that CGM improves health or prevents diabetes, and that it should answer a specific question rather than serve as a default.25
A staged design framework
Design
- Lock one sensor model, one wear site, and one firmware or algorithm version for the whole study, and record lot and session per participant. Never pool brands without a bridging analysis, because bias differences of 10 to 15 mg/dL exceed many effect sizes.
- Power for repeated, aggregated exposures rather than single meals. With single-exposure reliability around 0.14 to 0.31, budget at least three to four repetitions per condition and favor within-session crossover contrasts.
- Treat thresholds in healthy cohorts as exploratory. Above 140 mg/dL is normal, below 70 mg/dL is often artifact, and time in tight range is the metric most distorted by brand bias.
Collection
- Discard or flag the first 24 hours of each sensor session.
- Detect compression artifacts with sleep-position data and exclude confirmed compression lows from glycemic aggregates while keeping them in wear-time totals.
- Collect a reference sub-sample, venous or a validated capillary meter, during a standardized challenge such as an oral glucose tolerance test, so you can estimate each participant’s bias.
Analysis
- Report MAD in mg/dL alongside MARD, and report accuracy per glucose range and per rate-of-change band, not as one pooled figure.
- Prefer total area under the curve or mean glucose over incremental area under the curve, which reproduces poorly.
- Keep interpretation within sensor and within session, and confirm any clinically relevant low near 70 mg/dL with a fingerstick.
The methodological throughline: processed outputs hide their error
The deeper lesson generalizes beyond glucose. A CGM’s displayed mg/dL is not a measurement, it is a processed estimate: a raw electrochemical current passed through a proprietary calibration and smoothing pipeline. When a vendor exposes only that processed output, every error we have described, the bias, the lag correction, the day-1 instability, the smoothing, is baked in and invisible to the researcher. You cannot model what you cannot see. This is the same constraint that separates API-only access to a sleep or heart-rate device from direct SDK access to its underlying signal.
Centralive’s position across wearable modalities is that raw signal access through hardware SDKs is the methodological differentiator. For movement and cardiac signals, the Garmin Health Companion SDK and the Apple SDK expose raw accelerometry and beat-to-beat intervals, which let a single, transparent pipeline reprocess every participant’s data and quantify its own error, rather than inheriting a vendor’s hidden processing. The glucose literature is the cleanest cautionary tale for why that matters: when the real signal is small, a device’s undisclosed processing is not a detail, it is the result.
Caveats
Most pivotal accuracy data are manufacturer funded, and the strongest independent comparisons are small and conducted in people with type 1 diabetes. Critically, no large reference-checked accuracy study of current-generation sensors in people without diabetes was identified; the healthy-population evidence rests on older sensors and indirect reliability work, so the size of the problem with today’s devices is plausibly smaller than the inpatient figures but remains unquantified. Several device-detection and low-range figures in the underlying literature come from secondary reporting or preprints and should be checked against the primary papers before being cited in a protocol.
References
- Kovatchev BP, Patek SD, Ortiz EA, Breton MD. Assessing sensor accuracy for non-adjunct use of continuous glucose monitoring. Diabetes Technol Ther. 2015;17(3):177-186. doi:10.1089/dia.2014.0272
- Garg SK, Kipnes M, Castorino K, et al. Accuracy and safety of Dexcom G7 continuous glucose monitoring in adults with diabetes. Diabetes Technol Ther. 2022;24(6):373-380. doi:10.1089/dia.2022.0011
- Alva S, Brazg R, Castorino K, Kipnes M, Liljenquist DR, Liu H. Accuracy of the third generation of a 14-day continuous glucose monitoring system. Diabetes Ther. 2023;14(4):767-776. doi:10.1007/s13300-023-01385-6
- Alva S, Bailey T, Brazg R, et al. Accuracy of a 14-day factory-calibrated continuous glucose monitoring system with advanced algorithm in pediatric and adult population with diabetes. J Diabetes Sci Technol. 2022;16(1):70-77. doi:10.1177/1932296820958754
- Christiansen MP, Garg SK, Brazg R, et al. Accuracy of a fourth-generation subcutaneous continuous glucose sensor. Diabetes Technol Ther. 2017;19(8):446-456. doi:10.1089/dia.2017.0087
- Heinemann L, Schoemaker M, Schmelzeisen-Redeker G, et al. Benefits and limitations of MARD as a performance parameter for continuous glucose monitoring in the interstitial space. J Diabetes Sci Technol. 2020;14(1):135-150. doi:10.1177/1932296819855670
- Kirchsteiger H, Heinemann L, Freckmann G, et al. Performance comparison of CGM systems: MARD values are not always a reliable indicator of CGM system accuracy. J Diabetes Sci Technol. 2015;9(5):1030-1040. doi:10.1177/1932296815586013
- Eichenlaub M, Waldenmaier D, Wehrstedt S, et al. Performance of three continuous glucose monitoring systems in adults with type 1 diabetes. J Diabetes Sci Technol. 2026 (online 2025). doi:10.1177/19322968251315459
- Freckmann G, Eichenlaub M, Waldenmaier D, et al. Clinical performance evaluation of continuous glucose monitoring systems: a scoping review and recommendations for reporting. J Diabetes Sci Technol. 2023;17(6):1506-1526. doi:10.1177/19322968231190941
- Hanson K, Kipnes M, Tran H. Comparison of point accuracy between two widely used continuous glucose monitoring systems. J Diabetes Sci Technol. 2024;18(3):598-607. doi:10.1177/19322968231225676
- Pleus S, Eichenlaub M, Waldenmaier D, Freckmann G. Comment on the comparison of point accuracy between two widely used continuous glucose monitoring systems. J Diabetes Sci Technol. 2024. doi:10.1177/19322968241235218
- US Food and Drug Administration. 21 CFR 862.1355: Integrated continuous glucose monitoring system. ecfr.gov. Accessed October 2026.
- US Food and Drug Administration. 510(k) summary K234070 (Dexcom Stelo Glucose Biosensor System). accessdata.fda.gov. Accessed October 2026.
- US Food and Drug Administration. 510(k) summary K233655 (Abbott Lingo/Libre Rio). accessdata.fda.gov. Accessed October 2026.
- Parkes JL, Slatin SL, Pardo S, Ginsberg BH. A new consensus error grid to evaluate the clinical significance of inaccuracies in the measurement of blood glucose. Diabetes Care. 2000;23(8):1143-1148. doi:10.2337/diacare.23.8.1143
- Klonoff DC, Lias C, Vigersky R, et al. The Surveillance Error Grid. J Diabetes Sci Technol. 2014;8(4):658-672. doi:10.1177/1932296814539589
- Lingvay I, et al. Nocturnal hypoglycemia in the era of continuous glucose monitoring (review summarizing compression artifact data). J Diabetes Sci Technol. 2024. PMC11418455. pmc.ncbi.nlm.nih.gov. Accessed October 2026.
- Shah VN, DuBose SN, Li Z, et al. Continuous glucose monitoring profiles in healthy nondiabetic participants: a multicenter prospective study. J Clin Endocrinol Metab. 2019;104(10):4356-4364. doi:10.1210/jc.2018-02763
- Shahmoradi A, et al. Continuous glucose monitoring metrics in a community-based cohort without diabetes (Framingham Heart Study). J Clin Endocrinol Metab. 2025;110(4):1128-1137. (Author list and DOI pending manual verification before publication.)
- Howard R, Guo J, Hall KD. Imprecision nutrition? Different simultaneous continuous glucose monitors provide discordant meal rankings for incremental postprandial glucose in subjects without diabetes. Am J Clin Nutr. 2020;112(4):1114-1119. doi:10.1093/ajcn/nqaa198
- Hengist A, Ong JA, McNeel K, Guo J, Hall KD. Imprecision nutrition? Duplicate meals result in unreliable individual glycemic responses measured by continuous glucose monitors across four dietary patterns in adults without diabetes. Am J Clin Nutr. 2025;121(1):74-82. doi:10.1016/j.ajcnut.2024.10.007
- Stimson RH, et al. Detecting disorders of carbohydrate metabolism in a youthful non-diabetic cohort: a paired continuous glucose monitoring pilot study. Diabet Med. 2024. doi:10.1111/dme.15465 (time-below-range figures sensor-dependent; verify against source).
- Mauras N, Fox L, Englert K, et al. Lack of accuracy of continuous glucose sensors in healthy, nondiabetic children: results of the Diabetes Research in Children Network (DirecNet) accuracy study. J Pediatr. 2004;144(6):770-775. doi:10.1016/j.jpeds.2004.03.042
- Spartano NL, et al. Low interrater agreement among clinicians interpreting continuous glucose monitoring reports from people without diabetes. J Diabetes Sci Technol. 2025. doi:10.1177/19322968251315171
- Dower JA, Johansson L, Camp CL, Montori VM, Lipska KJ. Continuous glucose monitoring for persons with and without diabetes. JAMA Intern Med. 2026;186(9):1166-1173. doi:10.1001/jamainternmed.2026.2772
Sign up for the Centralive Newsletter: https://newsletter.centralive.health/signup