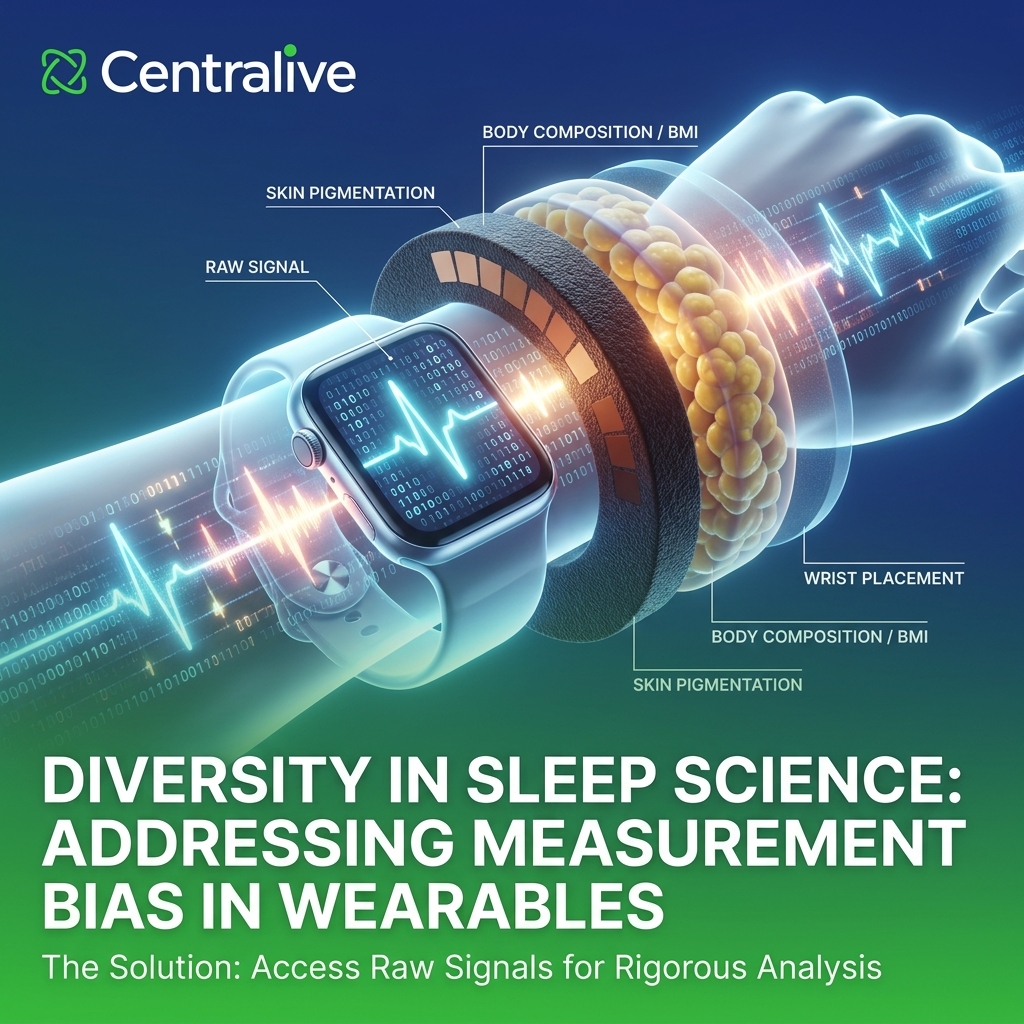
When you recruit a diverse cohort for a wearable sleep study, a practical question surfaces before the first night of data collection: will the device measure every participant equally well? If accuracy varies systematically with skin pigmentation, body composition, or which wrist the device sits on, then subgroup differences in your results may reflect measurement artifact rather than physiology. This post reviews the peer-reviewed evidence on all three factors, quantifies where the effects are real and where they are overstated, and closes with a staged framework for controlling them in study design.
The short version: skin tone is the best-documented and most mechanistically grounded source of bias, but its impact differs sharply by metric. BMI degrades signal quality through optical and anatomical mechanisms and is heavily confounded by comorbid sleep pathology. Dominant versus non-dominant wrist has a negligible effect on core sleep-summary metrics. The common thread is that all three become auditable only when you have access to raw signals rather than a vendor’s processed output.
The mechanism: why these factors could matter
Most wrist wearables infer heart rate and heart rate variability from photoplethysmography (PPG), which measures blood-volume pulsations from light reflected off tissue. Consumer devices predominantly use green light around 530 to 540 nm. Melanin, concentrated in the epidermis, absorbs shorter wavelengths most strongly, so green PPG loses more signal in darker skin than red or infrared light does. A review of PPG inaccuracy sources documented that switching a single-source LED from 535 nm to 590 nm increased the perfusion index by 1.2 to 7.1 times, pulsatile strength by 1.1 to 3.1 times, and signal-to-noise ratio by 1.3 to 2.6 times in Fitzpatrick type IV subjects.This is why wavelength choice and multi-wavelength designs are proposed as mitigation.
Adiposity acts through a related optical pathway plus an anatomical one: increased dermal thickness and subcutaneous fat move blood vessels deeper from the sensor and change the balance of absorbers and scatterers, reducing the detected pulsatile component. Wrist placement matters differently for the two sensing modalities. PPG signal quality is sensitive to contact pressure and limb posture; accelerometry-based sleep and wake detection is comparatively robust to which wrist the device sits on. Keeping these mechanisms distinct is the key to interpreting the evidence, because a metric derived from PPG (heart rate, HRV, PPG-based sleep staging) will behave differently from one derived from movement (actigraphy).
Factor 1: skin tone and pigmentation
Pulse oximetry: the strongest evidence
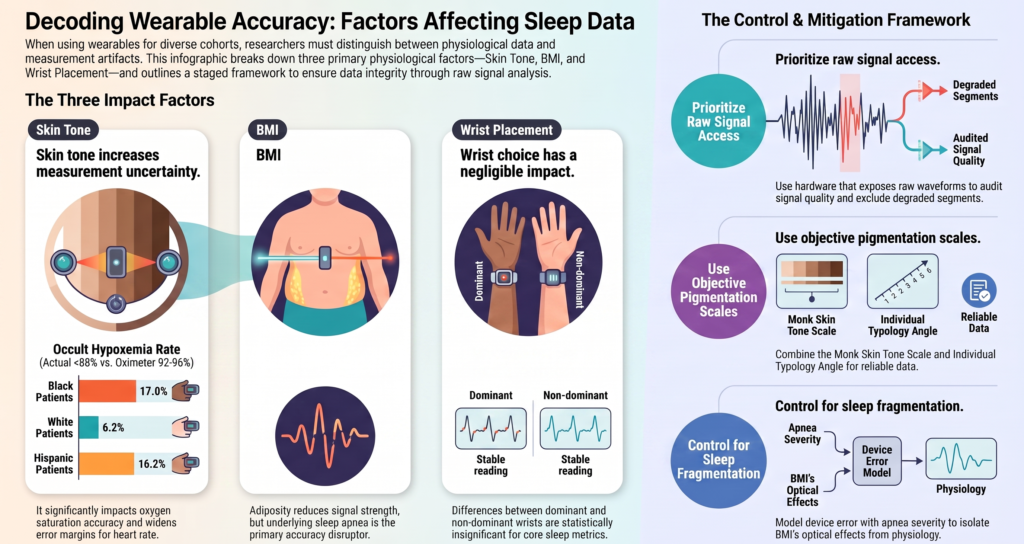
The clearest documented bias is in oxygen saturation. Sjoding and colleagues analyzed 10,789 paired oximeter and arterial measurements at one center plus 37,308 pairs from 178 intensive care units. Among patients reading 92 to 96 percent on the oximeter, occult hypoxemia (arterial saturation below 88 percent) occurred in 17.0 percent of Black patients versus 6.2 percent of White patients in the multicenter cohort, nearly three times the rate. The area under the curve for detecting saturation below 88 percent was 0.84 in Black versus 0.89 in White patients.A large Veterans Health Administration cohort found occult hypoxemia probabilities of 15.6 percent (White), 19.6 percent (Black), and 16.2 percent (Hispanic) among readings at or above 92 percent.A pediatric analysis found occult hypoxemia in 7 to 8 percent of children with the darkest skin versus 0 to 3 percent for the lightest.
A meta-analysis pooling 23 pulse-oximetry studies (197,353 paired observations) reported accuracy root-mean-square values of 3.96 percent (light), 4.71 percent (medium), and 4.15 percent (dark), all exceeding the 3 percent regulatory threshold, with pooled mean bias of +0.70, +0.27, and +1.27 percent respectively.The practical implication for study design: consumer-wearable oxygen saturation should be treated as screening-only in diverse cohorts, because overestimation in darker skin can mask hypoxemia.
Heart rate and HRV: mixed, and mostly a variance problem
For pulse rate the picture is genuinely split. A systematic review of 10 studies found that 4 reported significantly reduced heart rate accuracy in darker skin. Against this, the two most careful device-comparison studies found no significant skin-tone main effect. Bent and colleagues tested six devices against ECG in 53 participants and found no statistically significant difference across skin tones, though absolute error during activity averaged 30 percent higher than at rest. That study drew a methodological critique on sample-size and Fitzpatrick-reliability grounds, a debate worth reading in full. A Garmin study across Fitzpatrick types likewise found no significant main effect, with its two largest outliers in the highest Fitzpatrick category.A smaller Apple Watch pilot in Fitzpatrick II to IV subjects during graded exercise reported a similar pattern of increased error at the higher end of the range.
The most useful framing comes from the same meta-analysis: for wearable pulse rate, the 95 percent limits of agreement widened markedly in dark skin (-33.69 to +32.54 bpm) versus light skin (-16.02 to +13.54 bpm), yet pooled mean bias was not significantly different across groups (-1.24, -0.89, -0.57 bpm).In other words, skin tone inflates uncertainty more than it introduces systematic bias. That distinction matters: a study that reports only mean bias will conclude “no effect,” while a study that reports limits of agreement will see the phenotype-linked drift. HRV depends on accurate beat-to-beat interval detection, which degrades with signal-to-noise ratio, so the same variance inflation plausibly propagates into HRV and into PPG-based sleep staging, but few studies isolate this directly.
Sleep staging and regulatory context
Because PPG-based staging derives features from heart rate and HRV, skin-tone signal degradation should propagate into stage classification, but this is under-studied. A recent six-device validation explicitly noted that its sample was mostly light-skinned participants, that results cannot be generalized to darker skin, and that skin tone should be systematically collected in future work.No large study to date has powered a skin-tone-stratified sleep-staging analysis.
On the regulatory side, the FDA issued draft guidance in January 2025 recommending a diversely pigmented cohort of 150 or more participants with at least 25 percent in each skin-color group, alongside both subjective (Monk Skin Tone Scale) and objective (individual typology angle) pigmentation assessment.Independent testing of 34 oximeters under a controlled desaturation protocol found that 21 passed the anticipated ISO criteria but only 1 passed the anticipated FDA criteria, with 11 showing more positive bias in dark versus light pigmentation.Note the scope: this guidance targets medical pulse oximeters, not general-wellness consumer wearables, and remains draft.
Factor 2: BMI and body composition
Monte Carlo optical modeling of wrist PPG across BMI 20 to 45 showed that increased dermal thickness (from about 1.0 to more than 2.5 mm) and subcutaneous fat reduced the detected pulsatile signal. Empirically, a study of Hispanic adults found greater Bland-Altman dispersion among higher-BMI participants and concluded that small systematic biases linked to adiposity persist, warranting caution with rigid clinical heart rate thresholds in individuals with higher adiposity.Worth noting: a large wrist-PPG signal-quality analysis found that posture and sensor height dominated signal quality far more than body composition, so adiposity is one determinant among several rather than the leading one.
The larger issue with BMI is confounding, not optics. Higher-BMI populations carry far more obstructive sleep apnea: in an individual-participant meta-analysis of 12,860 adults, odds ratios for sleep apnea were 2.18 for overweight and 4.84 for obesity versus normal weight. Device agreement with polysomnography falls as sleep fragmentation rises. In a knee-osteoarthritis and insomnia cohort, a wrist device reached 85.76 percent accuracy and 95.95 percent sensitivity but only 50.96 percent specificity, with agreement higher on nights with longer total sleep time and fewer awakenings.Actigraphy overestimated sleep time far more in apnea patients (about 12.8 minutes) than in the whole sample.The methodological consequence is direct: in a high-BMI cohort you cannot attribute reduced accuracy to adiposity-related signal loss without controlling for apnea severity and sleep fragmentation, because both operate at once.
Factor 3: dominant hand and wrist placement
This is the factor researchers worry about most and need to worry about least. A dual-wrist study in which participants wore actigraphy on both wrists across 65 nights found no significant differences between wrists for any sleep variable, with correlations of 0.89 for sleep efficiency, 0.89 for sleep latency, 0.76 for wake after sleep onset, and above 0.90 for total sleep time. Wake after sleep onset and sleep-onset latency were the least reliable indices, but that unreliability is inherent to actigraphy rather than a function of wrist choice.
The AASM clinical practice guideline establishes the non-dominant wrist as the best-validated placement, with dominant-wrist or trunk placement reserved for limited-mobility populations where more movement capture is desired. The rationale is that the dominant hand performs more waking fine-motor activity, which could exaggerate movement counts. The practical recommendation is simple: standardize on the non-dominant wrist and record which wrist was used. The summary-metric penalty for the choice itself is negligible, but standardization removes a nuisance variable and matches the validated convention.
Why raw signal access is the methodological lever
All three factors share one implication: if you can only see a vendor’s processed sleep stages, you cannot detect or correct for signal degradation driven by pigmentation, adiposity, or placement. Raw-signal access lets you compute your own signal-quality index, perfusion index, and per-beat confidence, then stratify accuracy by signal quality and test whether residual subgroup differences survive that adjustment. That single analytical step separates optical degradation from algorithmic bias.
Hardware SDKs differ on exactly this axis. The Garmin Health SDK exposes raw Enhanced Beat-to-Beat Intervals with a per-beat confidence flag plus raw accelerometry, so degraded segments can be flagged and excluded rather than silently averaged in. The Apple SDK similarly provides raw sensor access. Oura, by contrast, is a closed, processed-output-only API. That is not a criticism of its accuracy, which is competitive, but a structural constraint: a study built on a processed-output API cannot independently recompute signal quality or re-score degraded epochs, so skin-tone and BMI effects remain invisible and un-auditable to the analyst.
Centralive’s own methods operate in this raw-signal paradigm. Our PPG-plus-respiration sleep-staging model uses a CNN-BiLSTM architecture on raw signals and reports 92.7 percent accuracy (kappa 0.768) for 2-stage, 80.2 percent (kappa 0.714) for 3-stage, and 76.8 percent (kappa 0.550) for 4-stage classification. Our smartwatch respiration-rate work reports mean absolute error of 2.29 breaths per minute on PPG-DaLiA using a transfer-learning approach on raw PPG and accelerometer data.Both depend on access to the underlying waveform, which is precisely what makes phenotype-driven signal quality measurable rather than assumed.
A staged framework for controlling these factors
Stage 1: design, before data collection
- Choose hardware that exposes raw signals with per-sample quality metadata (Garmin Enhanced BBI with confidence flags and raw accelerometry, or the Apple SDK). Treat processed-only APIs as acceptable only when the question does not require auditing signal quality across phenotypes.
- Capture skin tone with both a subjective scale (Monk Skin Tone) and an objective measure (individual typology angle via reflectance), not Fitzpatrick self-report alone, whose reliability is contested. Record BMI, wrist circumference, and apnea status.
- Standardize placement on the non-dominant wrist and log it.
Stage 2: analysis
- Report the full agreement toolkit: intraclass correlation and Cohen’s kappa for staging, Bland-Altman bias and limits of agreement (not mean bias alone, since the skin-tone effect appears as widened limits), MAPE, and sleep-wake sensitivity and specificity.
- Compute a per-epoch signal-quality index, stratify accuracy by it, and test whether subgroup differences by skin tone or BMI survive signal-quality adjustment.
- Model device error with apnea severity and sleep fragmentation as covariates so adiposity’s optical effect is not conflated with sleep-apnea physiology.
Stage 3: interpretation and thresholds
- Treat consumer oxygen saturation as screening-only in diverse cohorts, and do not use it as an apnea case-finding endpoint without clinical-oximeter corroboration.
- Escalate to device-specific recalibration or metric exclusion if the darkest-skin or highest-BMI subgroup shows heart rate or HRV error beyond about 5 bpm or 10 ms relative to the reference subgroup after signal-quality adjustment, or staging kappa dropping by more than 0.1 across subgroups.
A note on the limits of the evidence
The evidence base is uneven. Oxygen saturation bias by skin tone is strongly established across large multicenter cohorts. Consumer heart rate bias by skin tone is genuinely mixed, with the best device-comparison studies finding no significant main effect and a systematic review finding a minority of studies positive. HRV and sleep staging stratified by skin tone are thinly studied and under-powered. Many device studies are small, lab-based, and often conducted during exercise rather than sleep, so free-living overnight generalization is uncertain. Much of the heart rate literature relies on self-reported Fitzpatrick type, which correlates weakly with measured pigmentation. The BMI optical evidence leans heavily on simulation. And in real cohorts, BMI, apnea, skin tone, and motion co-vary, so attributing error to any single factor requires the covariate control that most existing studies lack. The most defensible position is to measure signal quality directly and let the data, not an assumption about any single phenotype, drive the conclusion.
References
- Sjoding MW, Dickson RP, Iwashyna TJ, Gay SE, Valley TS. Racial bias in pulse oximetry measurement. N Engl J Med. 2020;383:2477-2478. doi:10.1056/NEJMc2029240. PMID 33326721. https://doi.org/10.1056/NEJMc2029240 Back
- Wong A-KI, et al. Racial bias and reproducibility in pulse oximetry among medical and surgical inpatients in general care in the Veterans Health Administration 2013-19: multicenter retrospective cohort study. BMJ. 2022. https://www.ncbi.nlm.nih.gov/pmc/articles/PMC9254870/ Back
- Starnes JR, Welch W, Henderson CC, et al. Pulse oximetry and skin tone in children. N Engl J Med. 2025. doi:10.1056/NEJMc2414937. https://doi.org/10.1056/NEJMc2414937 Back
- Nelson BW, Singh S, et al. Impact of skin pigmentation on pulse oximetry blood oxygenation and wearable pulse rate accuracy: systematic review and meta-analysis. J Med Internet Res. 2024;26:e62769. doi:10.2196/62769. https://www.jmir.org/2024/1/e62769 Back
- Koerber D, Khan S, Shamsheri T, Kirubarajan A, Mehta S. Accuracy of heart rate measurement with wrist-worn wearable devices in various skin tones: a systematic review. J Racial Ethn Health Disparities. 2022. doi:10.1007/s40615-022-01446-9. PMID 36376641. https://doi.org/10.1007/s40615-022-01446-9 Back
- Bent B, Goldstein BA, Kibbe WA, Dunn JP. Investigating sources of inaccuracy in wearable optical heart rate sensors. npj Digit Med. 2020;3:18. doi:10.1038/s41746-020-0226-6. https://doi.org/10.1038/s41746-020-0226-6 Back
- Colvonen PJ, DeYoung PN, Bosompra NA, Owens RL. Limiting racial disparities and bias for wearable devices in health science research. Sleep. 2020;43(10):zsaa159. doi:10.1093/sleep/zsaa159. https://doi.org/10.1093/sleep/zsaa159 Back
- Sanudo B, De Hoyo M, Munoz-Lopez A, Perry J, Abt G. Pilot study assessing the influence of skin type on heart rate measurements with the Apple Watch. J Med Syst. 2019;43:195. doi:10.1007/s10916-019-1325-2. https://doi.org/10.1007/s10916-019-1325-2 Back
- Icenhower A, Murphy C, Brooks AK, et al. Investigating the accuracy of Garmin PPG sensors on differing skin types based on the Fitzpatrick scale. Front Digit Health. 2025;7:1553565. doi:10.3389/fdgth.2025.1553565. PMID 40212900. https://doi.org/10.3389/fdgth.2025.1553565 Back
- Ramella-Roman JC, et al. PPG-based heart rate accuracy in Hispanic adults with Fitzpatrick III to V skin tones: an evaluation of body composition and skin-tone effects. Sensors. 2026;26(10):2922. doi:10.3390/s26102922. https://doi.org/10.3390/s26102922 Back
- Fine J, Branan KL, Rodriguez AJ, et al. Sources of inaccuracy in photoplethysmography for continuous cardiovascular monitoring. Biosensors. 2021;11(4):126. doi:10.3390/bios11040126. https://doi.org/10.3390/bios11040126 Back
- Ajmal, Boonya-Ananta T, Rodriguez AJ, Du Le VN, Ramella-Roman JC. Monte Carlo analysis of optical heart rate sensors in commercial wearables: the effect of skin tone and obesity on the photoplethysmography signal. Biomed Opt Express. 2021;12(12):7445-7457. doi:10.1364/BOE.439893. https://doi.org/10.1364/BOE.439893 Back
- Charlton PH, et al. Determinants of photoplethysmography signal quality at the wrist. PLOS Digit Health. 2025;4(6):e0000585. doi:10.1371/journal.pdig.0000585. https://doi.org/10.1371/journal.pdig.0000585 Back
- Verbraecken J, et al. A performance validation of six commercial wrist-worn wearable sleep-tracking devices for sleep stage scoring compared to polysomnography. SLEEP Adv. 2025;6(2):zpaf021. doi:10.1093/sleepadvances/zpaf021. PMID 40303381. https://doi.org/10.1093/sleepadvances/zpaf021 Back
- Wrist-device sleep tracking in a knee-osteoarthritis and insomnia cohort. Sensors. 2024. https://www.ncbi.nlm.nih.gov/pmc/articles/PMC12349529/ Back
- Actigraphy versus polysomnography agreement in obstructive sleep apnea. Front Neurol. 2021. doi:10.3389/fneur.2021.629709. https://doi.org/10.3389/fneur.2021.629709 Back
- Does it matter which wrist an actigraphy device is worn on? Dual-wrist comparison of sleep variables. Sleep Sci. 2018. PMID 29410743. https://www.ncbi.nlm.nih.gov/pubmed/29410743 Back
- US Food and Drug Administration. Pulse Oximeters for Medical Purposes: Non-Clinical and Clinical Performance Testing, Labeling, and Premarket Submission Recommendations (draft guidance). January 2025. https://www.fda.gov/regulatory-information/search-fda-guidance-documents Back
- Comparison of pulse-oximeter performance across skin pigmentation under controlled desaturation: 34-device evaluation. medRxiv. 2025;2025.08.11.25332026. PMID 40832401. https://www.medrxiv.org/content/10.1101/2025.08.11.25332026 Back
- Smith MT, et al. Use of actigraphy for the evaluation of sleep disorders and circadian rhythm sleep-wake disorders: an American Academy of Sleep Medicine clinical practice guideline. J Clin Sleep Med. 2018;14(7):1231-1237. doi:10.5664/jcsm.7230. https://doi.org/10.5664/jcsm.7230 Back
- Kazemi K, Abiri A, Zhou Y, Rahmani AM, Khayat RN, Liljeberg P, Khine M. Improved sleep stage predictions by deep learning of photoplethysmogram and respiration patterns. Comput Biol Med. 2024;179:108679. doi:10.1016/j.compbiomed.2024.108679. PMID 39033682. https://doi.org/10.1016/j.compbiomed.2024.108679 Back
- Individual-participant-data meta-analysis of obstructive sleep apnea prevalence by BMI category across four community cohorts. eBioMedicine. 2025. https://www.sciencedirect.com/science/article/pii/S2589537025001531 Back
- Kazemi K, Azimi I, Liljeberg P, Rahmani AM. Respiration rate estimation via smartwatch-based photoplethysmography and accelerometer data: a transfer learning approach. Proc ACM IMWUT. 2025;9(1):Art. 7:1-24. doi:10.1145/3712280. https://doi.org/10.1145/3712280 Back
Sign up for the Centralive Newsletter: https://newsletter.centralive.health/signup