
Every team designing a real-world wearable study eventually hits the same question: how much data does a participant have to contribute before their record counts, and what do you do about the ones who fall short? The instinct is to reach for a familiar number, often “80 percent” or “at least four valid days,” write it into the protocol, and move on. That instinct is where a surprising amount of avoidable measurement error and sample bias enters a study. The honest answer is that there is no single correct compliance threshold. The right minimum depends on which metric you are estimating, and the mechanics of enforcing it depend on whether you can actually see enough of the signal to verify that a participant wore the device at all. This post works through both halves of the problem: how to set a defensible threshold, and how to enforce it in a way that does not quietly distort your cohort.
Compliance is not one number
Before choosing a threshold, it helps to separate three decisions that often get collapsed into a single rule. First, what makes a valid day (or a valid night)? Second, how many valid days or nights does a participant need for their record to be usable? Third, how do you detect that a device was genuinely being worn during those periods rather than sitting on a nightstand? Each of these is a distinct methodological choice, and each interacts with the specific quantity you are trying to estimate.
In physical-activity accelerometry the dominant convention is a valid day of at least 10 hours (600 minutes) of wear, with a valid record requiring at least four valid days including one weekend day. This lineage traces back to the hip-worn NHANES protocols and was carried into large wrist-worn cohorts such as the UK Biobank accelerometer sub-study. It is worth stating plainly that this rule is a pragmatic convention rather than an empirically optimal threshold, a point we return to at the end.
For sleep, a valid night generally requires that the main sleep period be captured without disqualifying gaps. The standard operational reference is the Society of Behavioral Sleep Medicine guide to actigraphy monitoring, which large consumer-tracker analyses have adapted into explicit criteria such as a minimum number of weekday and weekend nights. The number of nights you require is not arbitrary; as the reliability evidence below shows, it should be tied to the metric you care about most.
The mechanism: detecting non-wear
A compliance threshold is only as good as your ability to tell wear from non-wear. Two broad families of algorithms do this. Count-based methods, exemplified by the Choi algorithm, flag a window as non-wear when they observe a long run of zero activity counts, typically at least 90 consecutive minutes with a short allowance for isolated nonzero readings. Raw-acceleration methods, exemplified by the van Hees approach implemented in the open-source GGIR pipeline, classify a window as non-wear when the standard deviation and range of the raw acceleration signal fall below empirically set thresholds across at least two of the three axes.
The distinction matters for a practical reason: the raw-signal methods consistently outperform the count-based ones in head-to-head validation, and they can only be run if you have access to the raw acceleration stream in the first place. If your data source hands you a pre-scored wear or validity flag and nothing underneath it, you cannot audit that flag, tune the non-wear rule to your population, or reproduce the determination independently. Verification of compliance, in other words, presupposes access to the signal beneath the summary.
What the reliability evidence actually says
The most decision-relevant evidence is not about a global “percent compliance” figure at all. It is about how many valid nights you need before a given sleep metric stabilizes, and the answer is strongly metric-dependent and asymmetric between means and variability.
A consumer-tracker analysis of more than 100,000 nights from roughly 1,000 working adults found that reliable weekly mean total sleep time (intraclass correlation of 0.80) required about 5 nights, while a reliable monthly mean required roughly 10 nights. Estimating the variability of the same metric took considerably longer, on the order of 11 to 18 nights for a monthly estimate. A free-living actigraphy study reached compatible conclusions with a different rank order: about 5 nights for sleep efficiency and more than 7 nights for total sleep time, with total sleep time proving the least reliable metric in that design because of weekday-to-weekend variance.
That last point is easy to misread, so it is worth being explicit: free-living reliability and device-versus-polysomnography validity are different concepts and can rank the same metrics in opposite orders. In controlled validation against polysomnography, total sleep time and sleep efficiency tend to be the reliable metrics (intraclass correlations around 0.79 and 0.85 in older adults with sleep disturbance), whereas wake after sleep onset and sleep onset latency are the weak points (intraclass correlations around 0.33 and 0.32, often not statistically significant). Whichever framing applies to your study, wake after sleep onset and sleep onset latency deserve caution.
The single most consequential recent finding concerns sleep regularity. A pre-registered analysis of more than 10,000 users and roughly 3.7 million person-nights reported that reliable mean estimates needed only a handful of nights (about 7 for total sleep time, 3 for sleep onset, 5 for wake after sleep onset), but reliable variability estimates needed vastly more: on the order of 41 to 44 nights for timing metrics, and up to 62 to 65 nights for sleep percentage and wake after sleep onset variability. The accompanying editorial made the stakes concrete: at one week, variability metrics correlated at only about 0.50 to 0.58 with their stable values, and even doubling to two weeks left them well short of the 0.80 reliability bar, which means associations between sleep irregularity and health outcomes can be attenuated substantially by measurement noise. If your primary endpoint is a regularity or variability metric, a one-week protocol is not enough to support it.
The bias hidden inside your threshold
Raising a compliance threshold improves per-person accuracy but shrinks the retained sample, and it does so non-randomly. Participants who wear less tend to differ systematically from those who wear more, which is the familiar healthy-adherer problem. A recent analysis of nearly 12,000 Fitbit participants in a large national cohort quantified this directly: wear time was higher among older, higher-income, and more-educated participants and lower among those reporting depression or anxiety symptoms. The widely used 10-hour daily rule excluded 74.4 percent of data-days for participants with major depressive disorder, versus 20.9 percent for controls. A threshold set for data quality can, without anyone intending it, remove exactly the clinical population a study was meant to serve.
The methodological implication is not “use a loose threshold.” It is that the threshold is a source of potential bias that must be examined rather than assumed away: report the characteristics of excluded versus retained participants, test whether exclusion correlates with health or demographics, and prefer analytic adjustment (covariate control, imputation, adaptive thresholds) over blunt exclusion when working with clinical cohorts.
Enforcement, part one: design and behavior
Enforcement begins before a single participant is enrolled, in the choice of device and protocol. A comfortable, waterproof, continuously worn form factor with a battery that does not force a nightly removal produces higher compliance than a protocol built around a device that must be charged during the exact window you want to measure. The scale is achievable: the UK Biobank wrist-worn 24-hour protocol yielded valid data from 93.3 percent of returned devices, with a median of roughly 6.9 wear days.
The second design lever is real-time visibility. If data sync to your servers continuously, a compliance dashboard can flag a participant who has stopped contributing within a day rather than at the end of the study, when nothing can be done. Reminders and re-wear requests then have something to act on. Behavioral levers can add meaningful engagement on top of this: in a 12-month randomized trial in high-cardiovascular-risk adults, gamification and financial incentives each raised daily step counts by roughly 490 to 540 steps versus control, and the two combined added about 868 steps, an effect sustained after the incentives were withdrawn. The evidence base is strongest for activity outcomes rather than wear-time per se, so extrapolate with some care, but the direction is clear: active engagement infrastructure, not device possession alone, is what sustains compliance against the well-documented decline in wearable engagement over time.
Enforcement, part two: you can only enforce what you can verify
This is where study design and data architecture meet. Centralive’s own modeling work depends on access to underlying physiological signals rather than pre-scored summaries: a CNN-BiLSTM architecture that combines photoplethysmography and respiration for sleep staging, and a smartwatch respiration-rate estimation model built via transfer learning. The same property that makes those models possible is what makes compliance verifiable. If you can see raw accelerometry and beat-to-beat intervals, you can compute your own non-wear determination, confirm that data are genuinely present, and satisfy the “verification” layer of the industry-standard V3 evaluation framework, which asks whether the technology accurately captures and stores raw data in the first place.
Hardware SDKs make this posture practical. The Garmin Health Companion SDK exposes raw accelerometry and beat-to-beat intervals in real time, with no subscription barrier and accessible entry-level hardware, which is why it works well as a first-class research platform: you own the non-wear logic and can audit every validity decision. A closed, processed-output-only API sits at the other end of the spectrum. Oura is the standing structural counterexample here, and the point is not a criticism of the product but a constraint relevant to study design: when the interface returns the vendor’s own wear and validity determination and nothing beneath it, you cannot distinguish true non-wear from an algorithmic gap or an imputed value, and you inherit whatever the vendor decides.
The sleep-science community has flagged exactly this. A 2024 consensus statement noted that most consumer-grade devices do not expose true raw sensor data and rely on proprietary, largely opaque algorithms, which raises concerns about the reproducibility of research built on their outputs, and it cautioned that metrics lacking a standard definition should not be used in clinical or research studies.A related concern is algorithm drift: a proprietary staging algorithm can change with a firmware update mid-study, so validation of one version does not transfer to another. Some vendors now mitigate this by offering a firmware freeze for research and advance notice of major updates, a real but partial fix that still leaves the underlying wear determination opaque.
A staged framework for setting and enforcing your threshold
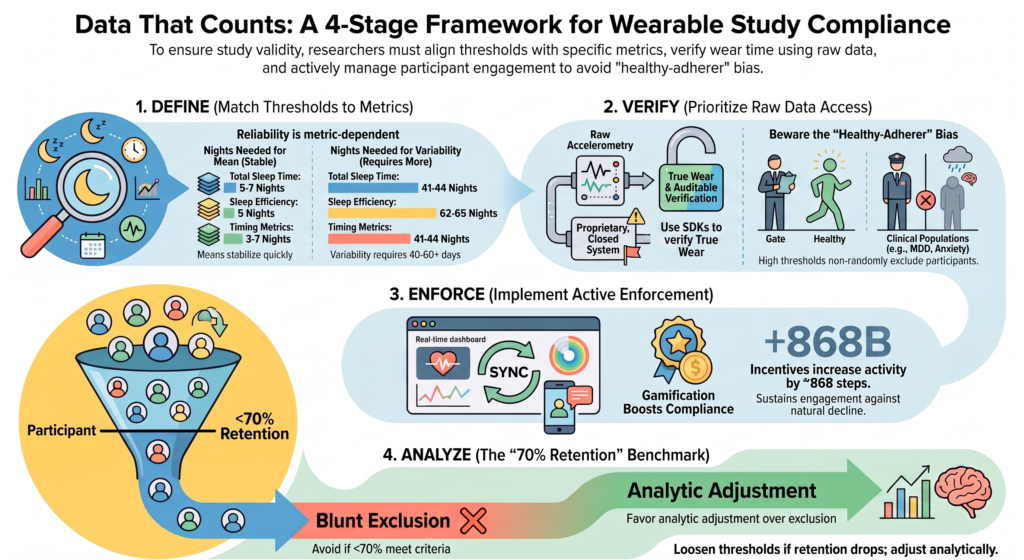
Stage 1, define before you collect. Fix your valid-day or valid-night rule and your minimum-days or minimum-nights criterion in advance, and choose the minimum by your primary metric. For physical activity, at least four valid days of at least 10 hours with one weekend day is the defensible convention. For habitual mean sleep duration or timing, target at least 5 to 7 valid nights; for sleep efficiency, at least 5 nights; for wake after sleep onset and sleep onset latency, expect low reliability and require more. For any regularity or variability endpoint, require at least two weeks and ideally six or more, and state explicitly that shorter windows cannot support a variability claim.
Stage 2, choose a device and pipeline you can verify. Prefer devices that expose raw accelerometry and beat-to-beat intervals through an SDK so you can compute non-wear yourself and meet the verification standard. If you must use a processed-output API, document that wear and validity are vendor-determined, freeze firmware where possible, record algorithm versions, and name that dependency as a limitation in your methods.
Stage 3, enforce actively. Ingest data server-side in near-real-time, run a compliance dashboard, and trigger reminders or re-wear requests when gaps appear. Budget for engagement infrastructure, and consider incentives or gamification where budget and ethics allow.
Stage 4, analyze without silently biasing. Report retained versus excluded sample characteristics, test whether exclusion correlates with health or demographics, run sensitivity analyses across two or three thresholds, and use imputation or covariate adjustment rather than blunt exclusion when serving clinical populations.
Two benchmarks should change the plan when you hit them. If fewer than about 70 percent of enrolled participants meet your criterion, or if those excluded differ systematically from those retained, loosen the threshold and add analytic adjustment rather than accept a biased sample. And if your primary outcome is a variability metric and you have less than two weeks of data, do not report it as a primary endpoint.
Where the evidence is thin
Methodological honesty requires flagging the soft spots. The 10-hour, four-day rule is an inherited convention rather than an optimized threshold. Reliability targets differ across studies (an intraclass correlation of 0.70 in some, 0.80 in others), so the “how many nights” answer shifts with the bar you set. The incentive evidence comes largely from step-count interventions rather than wear-time compliance directly, and gamification and financial incentives are frequently bundled in the same trial arm, which makes their independent effects hard to separate. Some of the wear-time bias evidence is drawn from preprints and should be treated as provisional pending peer review. None of this undermines the core recommendation; it simply means the threshold you set is a modeling choice to be defended and stress-tested, not a fixed constant to be copied.
References
- Doherty A, Jackson D, Hammerla N, et al. Large scale population assessment of physical activity using wrist worn accelerometers: the UK Biobank study. PLoS ONE. 2017;12(2):e0169649. DOI: 10.1371/journal.pone.0169649. https://doi.org/10.1371/journal.pone.0169649 Back
- Ancoli-Israel S, Martin JL, Blackwell T, et al. The SBSM guide to actigraphy monitoring: clinical and research applications. Behav Sleep Med. 2015;13(sup1):S4-S38. DOI: 10.1080/15402002.2015.1046356. https://doi.org/10.1080/15402002.2015.1046356 Back
- Choi L, Liu Z, Matthews CE, Buchowski MS. Validation of accelerometer wear and nonwear time classification algorithm. Med Sci Sports Exerc. 2011;43(2):357-364. PMID: 20581716. DOI: 10.1249/MSS.0b013e3181ed61a3. https://doi.org/10.1249/MSS.0b013e3181ed61a3 Back
- Migueles JH, Rowlands AV, Huber F, Sabia S, van Hees VT. GGIR: a research community-driven open source R package for generating physical activity and sleep outcomes from multi-day raw accelerometer data. J Meas Phys Behav. 2019;2(3):188-196. DOI: 10.1123/jmpb.2018-0063. https://doi.org/10.1123/jmpb.2018-0063 Back
- Minimum number of nights for reliable estimation of habitual sleep using a consumer sleep tracker. Sleep Adv. 2022;3(1):zpac026. DOI: 10.1093/sleepadvances/zpac026. https://doi.org/10.1093/sleepadvances/zpac026 Back
- Aili K, Astrom-Paulsson S, Stoetzer U, Svartengren M, Hillert L. Reliability of actigraphy and subjective sleep measurements in adults: the design of sleep assessments. J Clin Sleep Med. 2017;13(1):39-47. PMID: 27707448. DOI: 10.5664/jcsm.6384. https://doi.org/10.5664/jcsm.6384 Back
- Moderately strong intraclass correlations between actigraphic and polysomnographic total sleep time and sleep efficiency in older adults with sleep disturbance. PMC12000170. https://www.ncbi.nlm.nih.gov/pmc/articles/PMC12000170/ Back
- Leota J, Presby DM, Le F, et al. How many nights are needed? The short-term stability of intraindividual variability in sleep parameters derived from accelerometry data in a cohort of normal sleepers. Sleep. 2026;49(6):zsag040. DOI: 10.1093/sleep/zsag040. https://doi.org/10.1093/sleep/zsag040 Back
- Soon CS, Chee MWL. Editorial: how many nights of wearable data are enough? Sleep. 2026;49(6):zsag083. DOI: 10.1093/sleep/zsag083. https://doi.org/10.1093/sleep/zsag083 Back
- Population differences in wearable device wear time: rescuing data to address biases and advance health equity. medRxiv. 2026. DOI: 10.64898/2026.03.06.26347799. https://www.medrxiv.org/content/10.64898/2026.03.06.26347799v1.full Back
- Fanaroff AC, Patel MS, Chokshi N, et al. Effect of gamification, financial incentives, or both to increase physical activity among patients at high risk of cardiovascular events: the BE ACTIVE randomized controlled trial. Circulation. 2024;149(21):1639-1649. PMID: 38583084. DOI: 10.1161/CIRCULATIONAHA.124.069328. https://doi.org/10.1161/CIRCULATIONAHA.124.069328 Back
- Centralive sleep staging model combining photoplethysmography and respiration (CNN-BiLSTM architecture). Comput Biol Med. PMID: 39033682. https://pubmed.ncbi.nlm.nih.gov/39033682/ Back
- Centralive smartwatch respiration rate estimation via transfer learning. Proc ACM Interact Mob Wearable Ubiquitous Technol (IMWUT). 2025. DOI: 10.1145/3712280. https://doi.org/10.1145/3712280 Back
- Goldsack JC, Coravos A, Bakker JP, et al. Verification, analytical validation, and clinical validation (V3): the foundation of determining fit-for-purpose for biometric monitoring technologies (BioMeTs). npj Digit Med. 2020;3:55. DOI: 10.1038/s41746-020-0260-4. https://doi.org/10.1038/s41746-020-0260-4 Back
- de Zambotti M, Goldstein C, Cook J, et al. State of the science and recommendations for using wearable technology in sleep and circadian research. Sleep. 2024;47(4):zsad325. PMID: 38149978. DOI: 10.1093/sleep/zsad325. https://doi.org/10.1093/sleep/zsad325 Back
- Chee MWL, Walch O. Revisiting customized algorithms for research grade devices. Sleep. 2025;48(4):zsaf011. DOI: 10.1093/sleep/zsaf011. https://doi.org/10.1093/sleep/zsaf011 Back
Sign up for the Centralive Newsletter: https://newsletter.centralive.health/signup